Overview
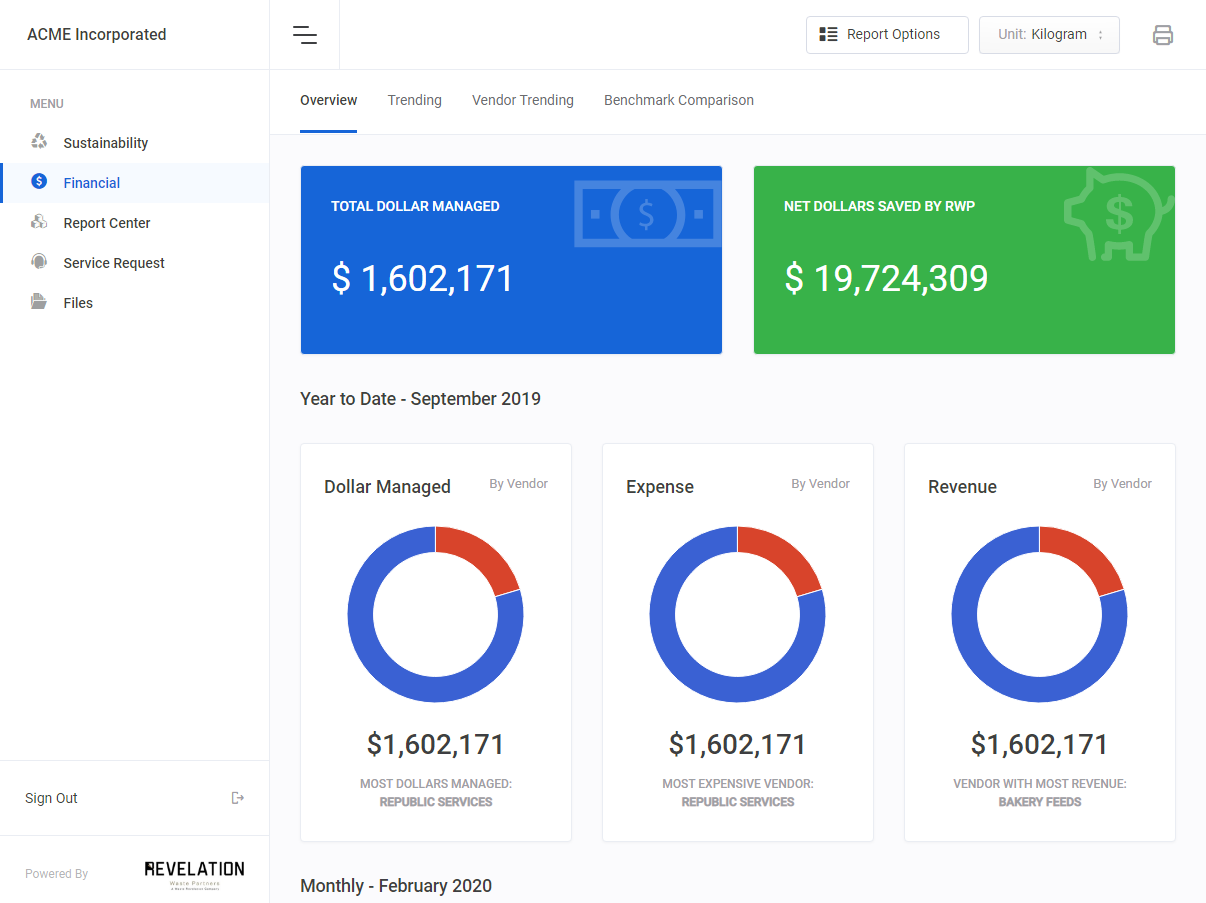
RWP portal-based financials tell you what you want to know overall immediately. With some recycling and by-product management at a net revenue while other waste streams are at a cost, your total financial status can be confusing. Breaking financials by revenue vs. cost and total dollars in management are important to see. Trending by month gives you a comparison also to see how activities are progressing.
Do you want your viewing to focus in on an individual site, or company wide with all your operations in summary? Not a problem for RWP's data presentation. Just a few selections by report settings or limitations set by user will present just what is desired.

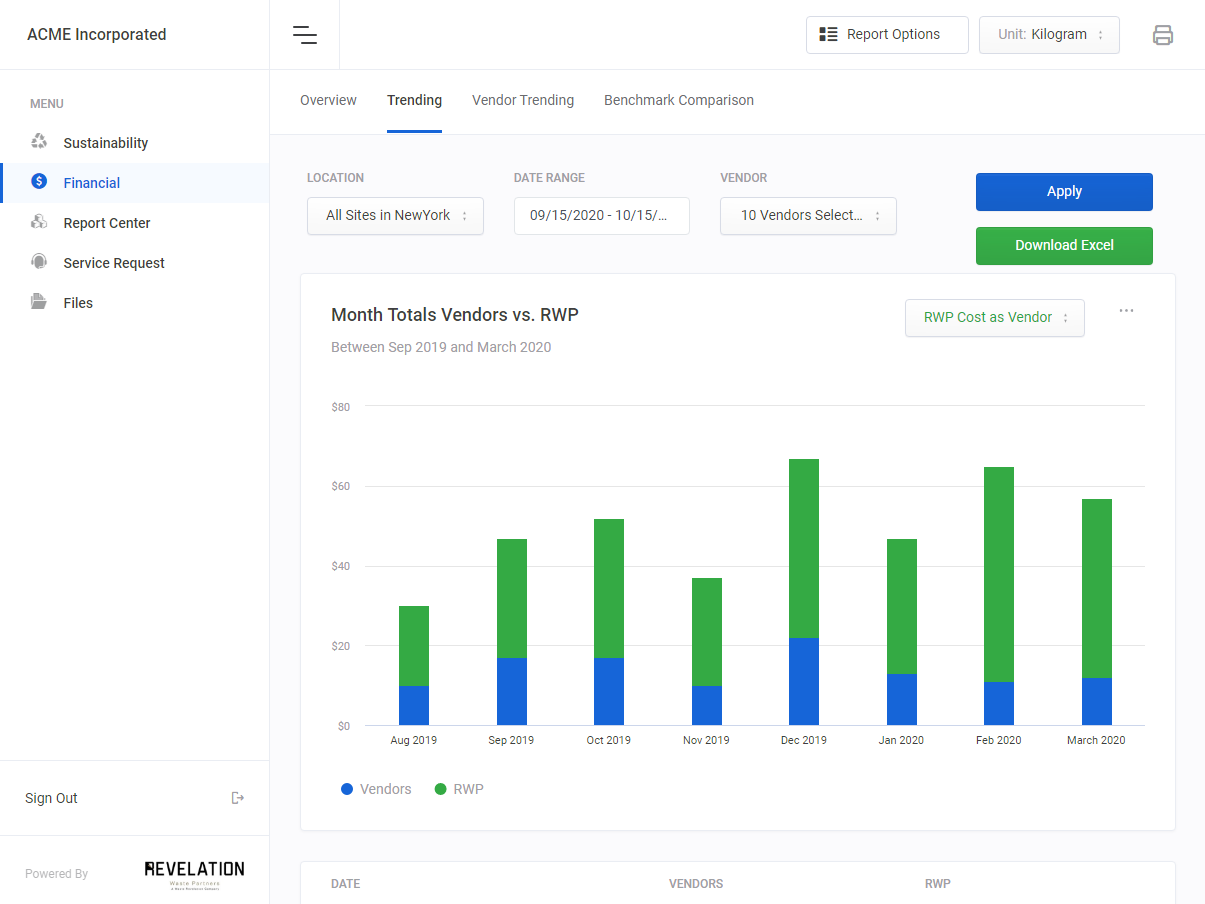
Financial Trending
Drilling down into details of month over month presentation is easy with our Financial Trending. Filtering capabilities again allow the user to look at the activity occurring for one, a couple or all sites that access to financial detail is granted. Including what you are paying RWP!

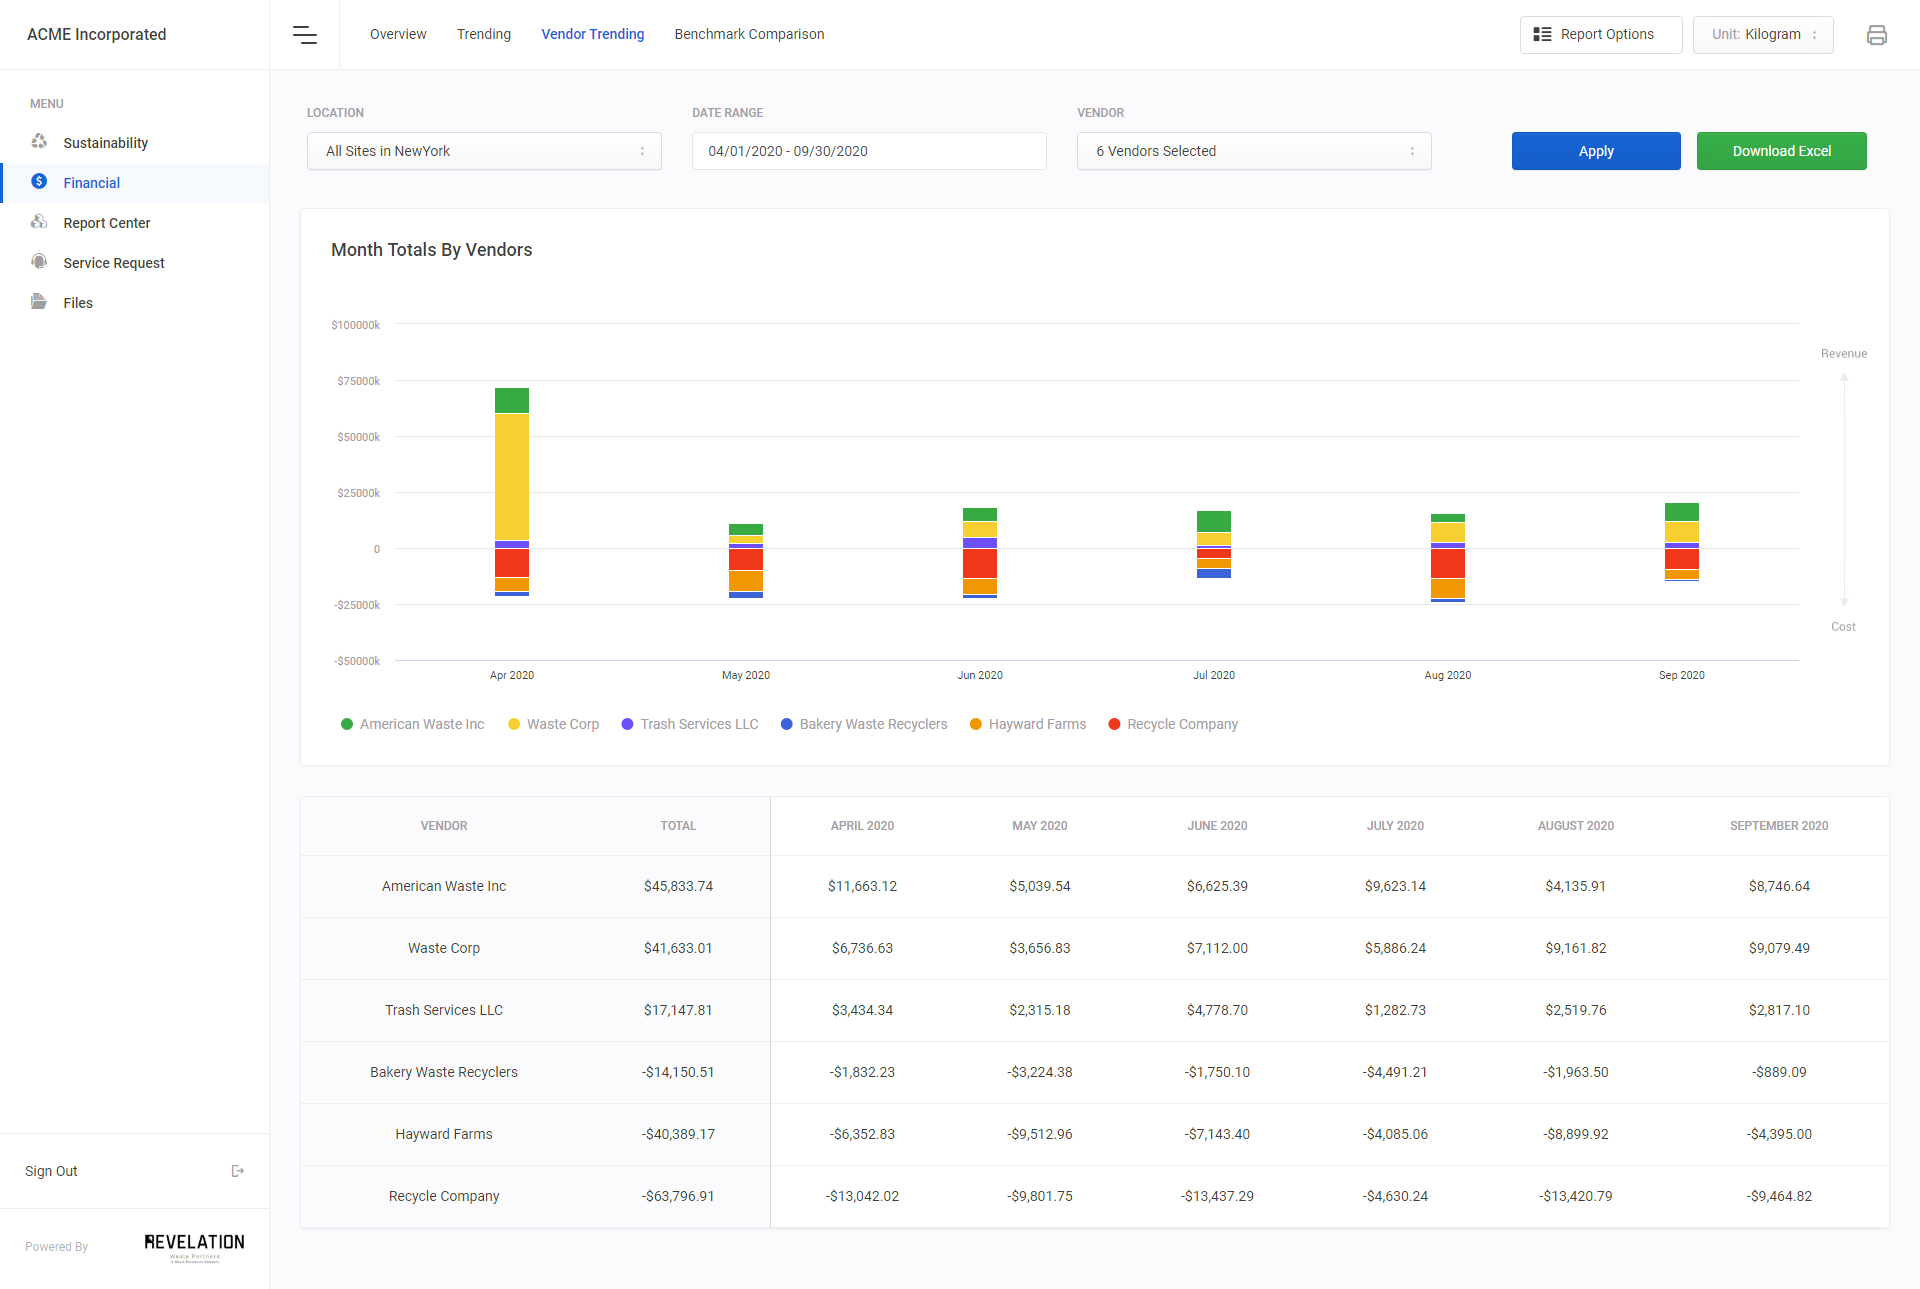
Vendor Trending
If it is a vendor's revenue and/or expense you are interested in viewing at a location, the visibility is easy to see at a click. Desiring to know what your company's entire book of business is doing with a specific service provider? Just set the visibility selection to corporate wide and have the question instantly answered.

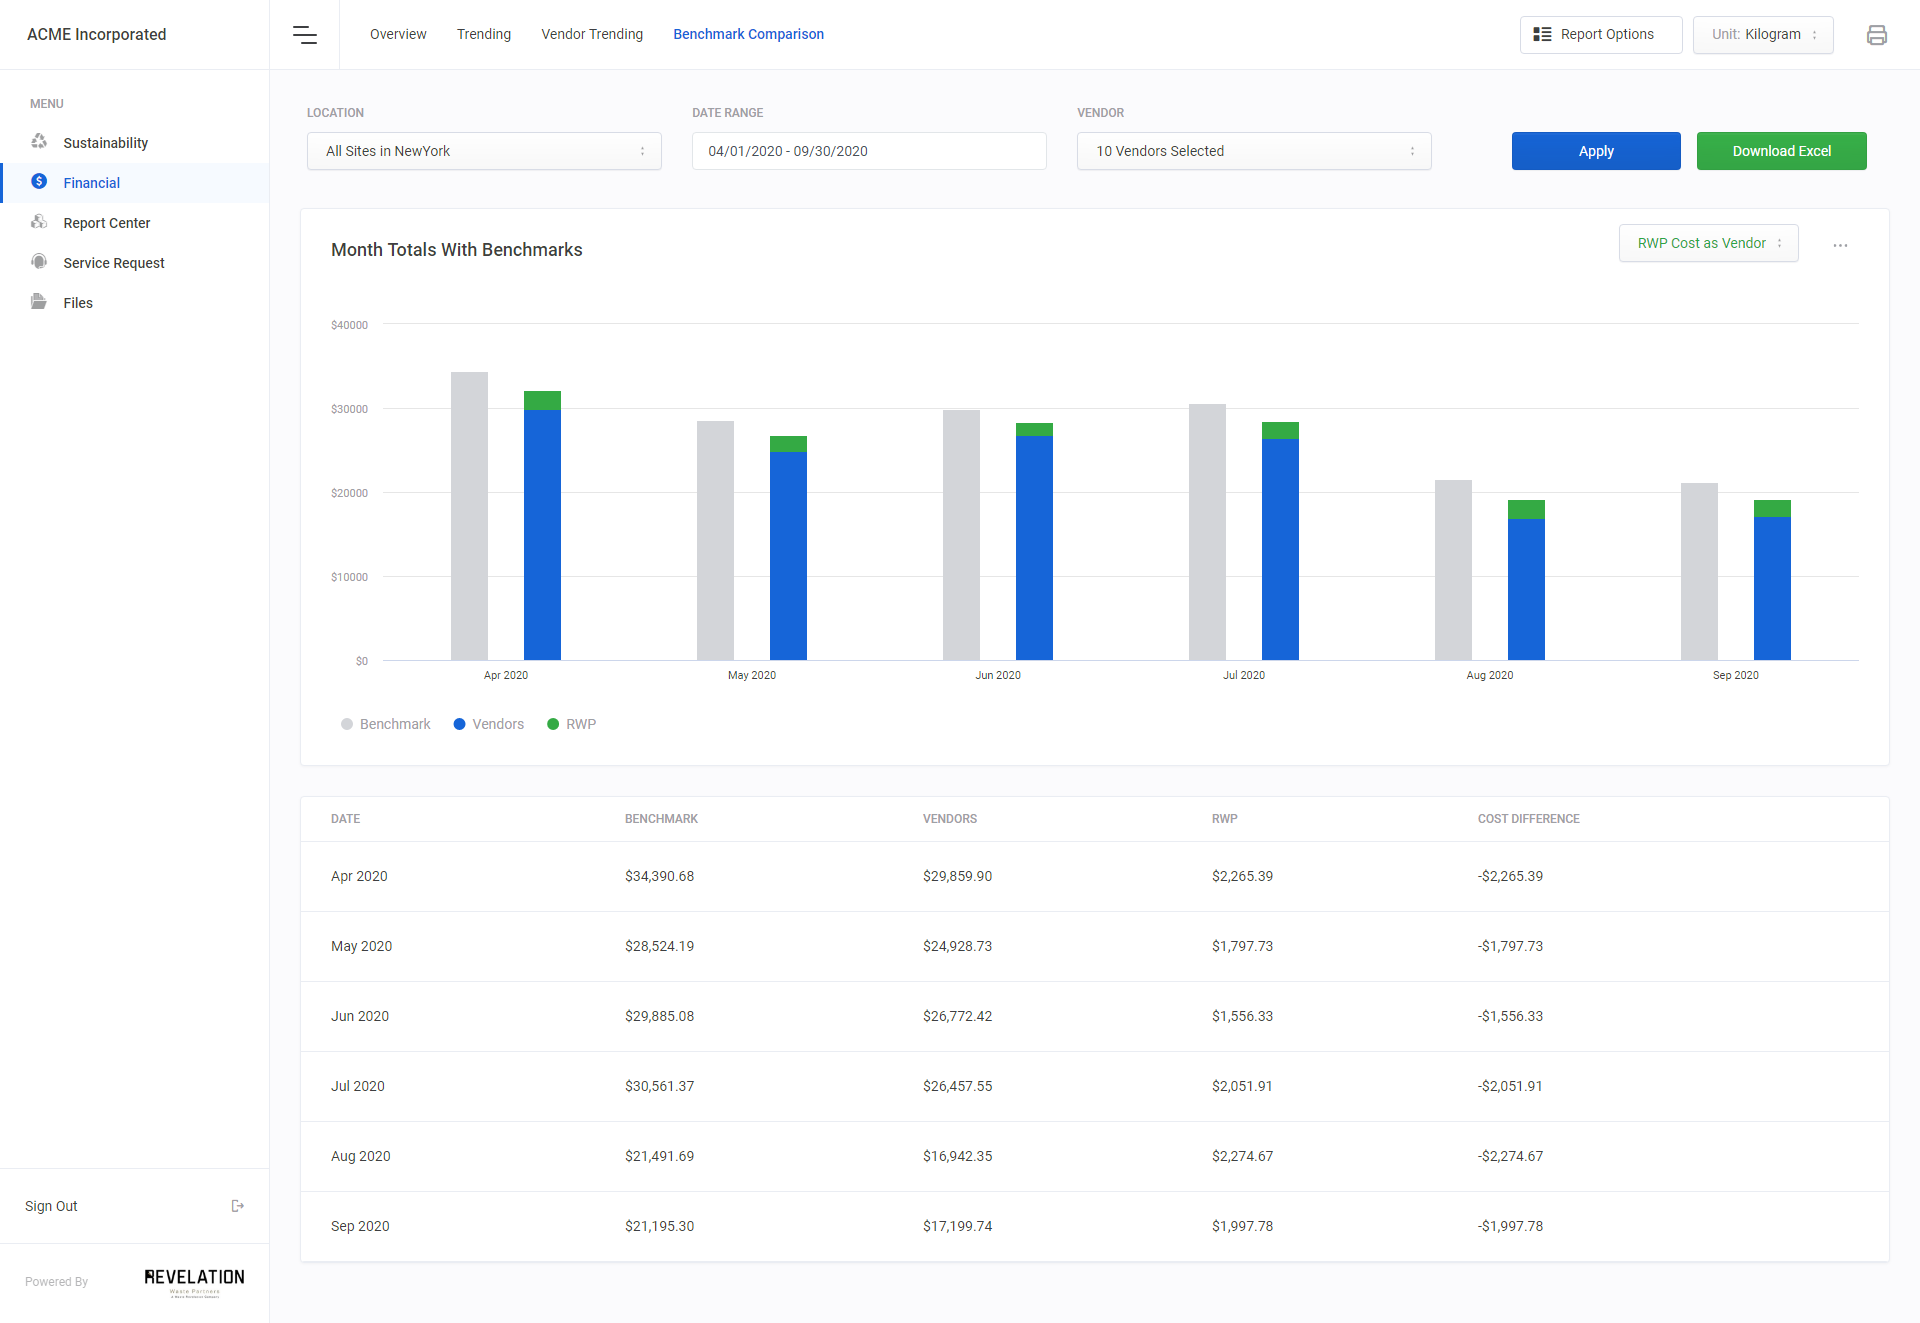
Benchmark Comparisons
Changes for financial success are not effective unless the follow thru is there confirming effectiveness. RWP tracks the improvements of our recommendations for your operations so you see month over month how they impact your bottom line. Improvements viewable if excluding or including RWP expenses with interest of full transparency of RWP's work product.
